What it means for you
Compare offers using the same loan amount, loan type, and timing. A rate alone does not tell you what you will pay.
Compare your Loan Estimates →
This small Missouri study did not establish an overall winner. Broker-submitted loans had somewhat lower origination charges after lender credits, while direct applications had slightly lower interest rates. Your actual offers matter more than the channel label.
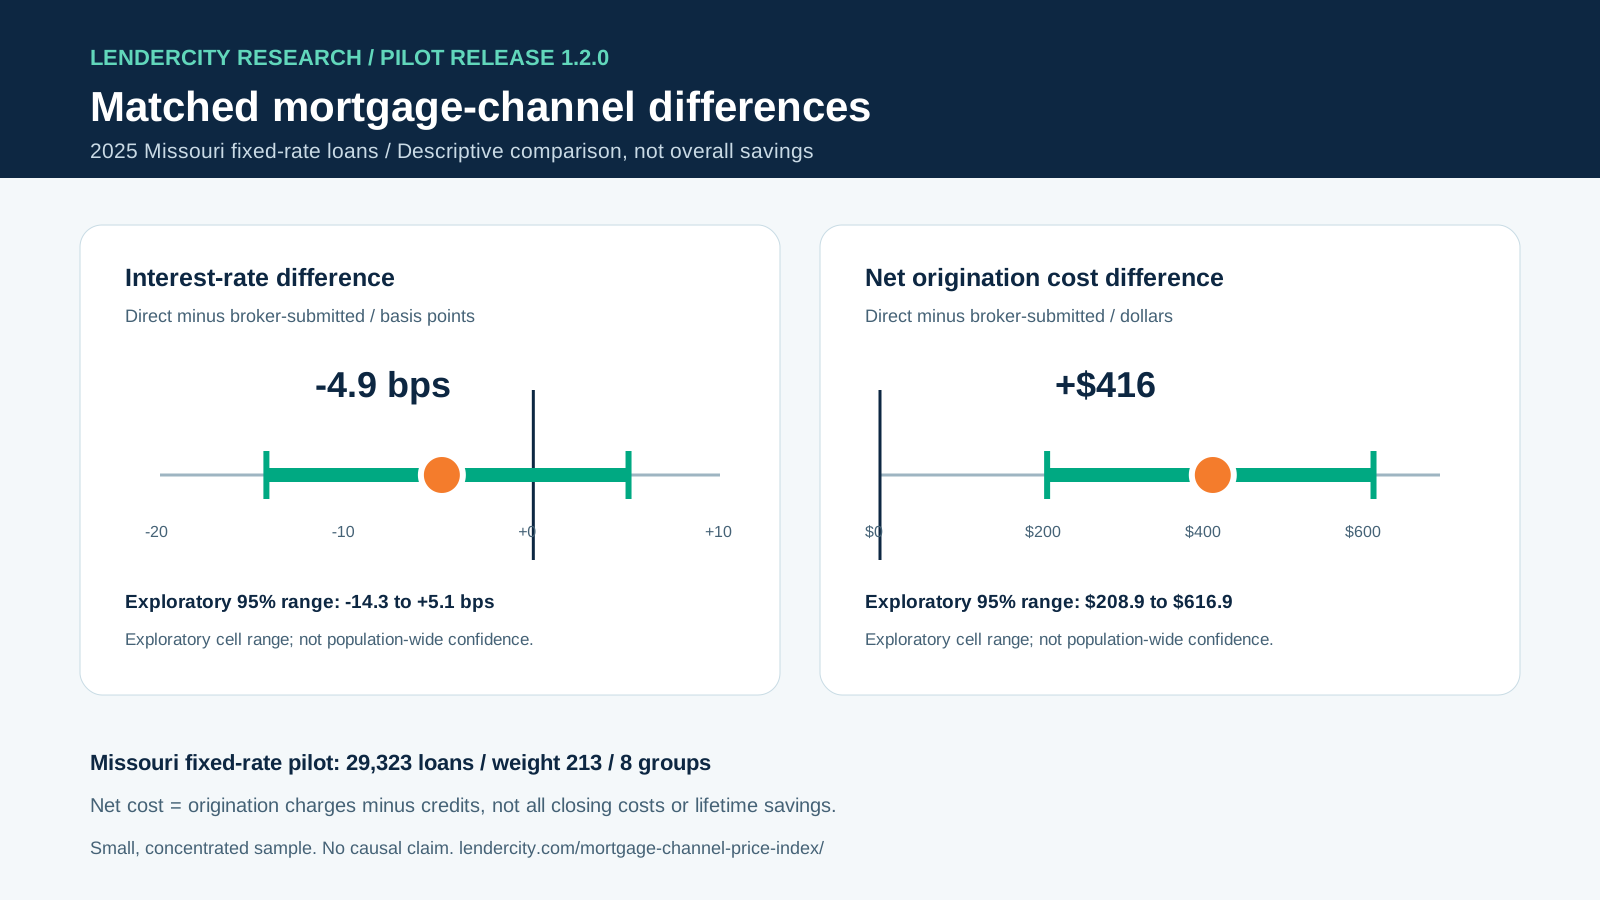
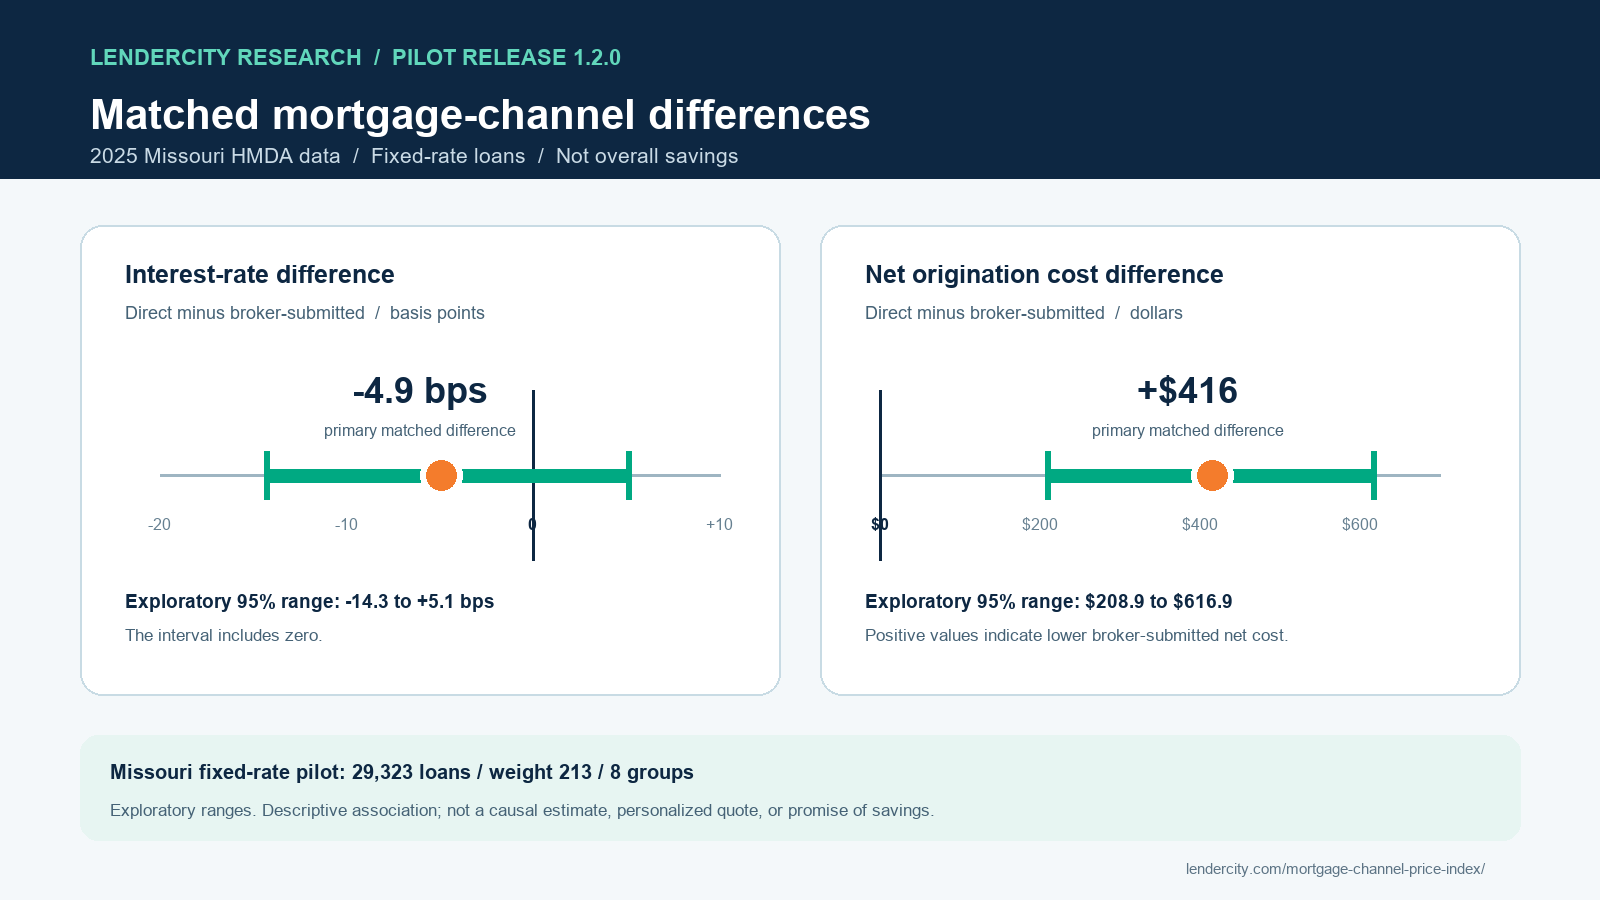
After grouping similar loans, broker-submitted loans had about $416 lower origination charges after lender credits. Direct applications had interest rates about 0.05 percentage points lower. That does not tell us which option cost less overall.
These are historical group comparisons, not two offers made to the same person. The cost figure does not include every closing expense or interest paid over time. The rate difference is uncertain, and this small sample cannot establish that either channel is better for you.
Compare offers using the same loan amount, loan type, and timing. A rate alone does not tell you what you will pay.
Compare your Loan Estimates →This pilot does not show that brokers save everyone money, that direct lenders are cheaper overall, or that LenderCity’s Exchange caused any savings.
The final comparison uses 2,232 direct loans and 213 broker-submitted loans in 8 groups. A few lenders account for much of the broker sample. Important pricing details are unavailable.
2025 Missouri conventional, 30-year fixed-rate purchase loans. Pilot evidence, not a promise of savings. The figures below are associations, not a measure of the effect of choosing a channel.
29,323 loans meet the revised cohort rules. The smaller channel count in each group gives an effective weighting total of 213; these are not individually matched borrower pairs.
Direct minus broker-submitted; 10,000 matched-cell bootstrap draws.
Direct minus broker-submitted; positive values indicate lower broker-submitted net cost.
Exploratory matched-cell bootstrap, 10,000 draws, seed 20250921. These ranges resample only 8 cell summaries. They do not capture all within-cell or lender-level uncertainty and are not population-wide or causal confidence intervals.
These medians describe every qualifying loan in each channel before exact-cell matching.
Net origination cost: reported origination charges minus reported lender credits. It is not total closing cost or cash to close.
Originated conventional home-purchase loans; first lien; 360-month term and introductory-rate period reported as NA (fixed rate); owner-occupied, one-unit, site-built property; not reverse, open-end, or business purpose; initially payable to the reporting institution.
https://ffiec.cfpb.gov/v2/data-browser-api/view/csv?states=MO&years=2025&actions_taken=1&loan_types=1Run the HMDA query →Download the analysis code. Requires Node.js and the documented source extract. Save the citation export helper at public/research/citation-context.mjs relative to the working directory. Later source revisions may differ; compare the source fingerprint. Official fixed-rate reporting guidance.
All specifications require 20 loans per channel per cell. Cost differences retain their direction, but amounts and sample coverage change substantially. Two narrow-band cells do not establish robustness.
Weighting total: 213
-4.9 bps rate difference
$416 net cost difference
Loan bands $100,000 · LTV 10 points · income $50,000
Weighting total: 43
-34.0 bps rate difference
$699 net cost difference
Loan bands $50,000 · LTV 5 points · income $25,000
Weighting total: 869
-2.3 bps rate difference
$271 net cost difference
Loan bands $150,000 · LTV 15 points · income $75,000
Cell values are aggregate medians. “Effective pairs” is the smaller channel count in each cell, not a borrower-level match.
| Cell | Loan band center | LTV band center | DTI band | Direct / broker | Effective pairs | Rate difference | Net cost difference |
|---|---|---|---|---|---|---|---|
| Cell 1 | $100,000 | 100% | 30%-<36% | 251 / 32 | 32 | -12.5 bps | $491 |
| Cell 2 | $100,000 | 100% | 20%-<30% | 227 / 22 | 22 | +6.3 bps | $365 |
| Cell 3 | $300,000 | 80% | 20%-<30% | 188 / 20 | 20 | +12.5 bps | -$270 |
| Cell 4 | $200,000 | 80% | 30%-<36% | 223 / 28 | 28 | +11.7 bps | $264 |
| Cell 5 | $200,000 | 100% | 30%-<36% | 304 / 23 | 23 | 0.0 bps | $1,067 |
| Cell 6 | $200,000 | 100% | 30%-<36% | 381 / 30 | 30 | -31.2 bps | $538 |
| Cell 7 | $200,000 | 80% | 20%-<30% | 331 / 24 | 24 | 0.0 bps | $428 |
| Cell 8 | $200,000 | 100% | 20%-<30% | 327 / 34 | 34 | -12.5 bps | $351 |
Reporting-lender concentration: 26 institutions contribute the 213 broker-submitted loans. The largest accounts for 93 (43.7%); the top three account for 146. These are reporting institutions, not counts of brokerage firms. Concentration limits how broadly this result can be applied.
Among 29,323 qualifying originations. Cost medians use 26,327 direct and 2,348 broker-submitted records with both components available. 19,741 blank credit fields mean no lender credits, not missing data.
submission_of_applicationIdentifies direct submission or indirect submission through a mortgage broker.
initially_payable_to_institutionRestricts the cohort to loans initially payable to the reporting institution.
interest_rateReported note rate, expressed as a percentage.
rate_spreadReported spread over the applicable average prime offer rate; converted to basis points.
origination_chargesReported borrower-paid origination charges.
lender_creditsReported lender credits.
intro_rate_periodNA for the fixed-rate cohort; numeric rate-changing periods and Exempt are excluded.
loan_amount / loan_to_value_ratio / incomeRounded to the nearest band center for matching. Income is reported in thousands of dollars; LTV is combined debt secured by the property relative to its value.
debt_to_income_ratio / conforming_loan_limitExact reported DTI category and conforming status. Blank, NA, and Exempt DTI, and undetermined conforming status, cannot enter matching.
net_origination_costOrigination charges minus lender credits; not total closing cost or cash to close.
effective_loan_pairsSum of the smaller channel count in each qualifying matched cell; not a one-to-one borrower match.
The chart keeps the two measures on separate scales and repeats the pilot, geography, effective sample, and non-causal limitation.

Keep the pilot label, geography, version, effective matched sample, descriptive framing, and limitations with any quoted finding.
LenderCity's 2025 Missouri pilot of conventional, 30-year fixed-rate home-purchase loans (version 1.2.0, updated 2026-09-21) found no overall winner. Matched origination charges after lender credits were about $416 lower for broker-submitted loans. Rates were about 0.05 percentage points lower for direct applications. The comparison used 2,232 direct loans and 213 broker-submitted loans across 8 groups, with an effective weighting total of 213, not individually matched borrowers. These historical group differences are associations, not proof that choosing a channel causes savings. The cost measure excludes other closing expenses and interest over time; the rate difference is uncertain. A few reporting lenders account for much of the broker sample, and important pricing details are unavailable. This is not today's pricing, a prediction of savings, or evidence of LenderCity Exchange results. Source and methods: https://www.lendercity.com/mortgage-channel-price-index/
LenderCity. LenderCity Historical Channel Price Gap: 2025 Missouri pilot. Version 1.2.0, updated September 21, 2026. https://www.lendercity.com/mortgage-channel-price-index/
LenderCity. (2026). LenderCity historical channel price gap: 2025 Missouri pilot (Version 1.2.0) [Data set and research report]. https://www.lendercity.com/mortgage-channel-price-index/
@dataset{LenderCity2026ChannelPriceGap,
  author = {{LenderCity}},
  title = {LenderCity Historical Channel Price Gap: 2025 Missouri Pilot},
  year = {2026},
  version = {1.2.0},
  url = {https://www.lendercity.com/mortgage-channel-price-index/},
  note = {Descriptive pilot; updated 2026-09-21}
}Corrected fixed-rate eligibility (3,194 rate-changing loans removed from the prior cohort), unavailable DTI handling, and sensitivity tests (minimum 20 per channel in every specification). Preserved blank lender credits as zero under HMDA instructions. Delayed rounding until presentation. Primary result changed from $385 / -6.1 bps / 214 effective pairs to about $416 / -4.9 bps / 213. Added reporting-lender concentration, source fingerprint, and plain-language findings. Prior release files remain archived; this is an internal computational review, not external peer review.
Added uncertainty ranges, cell results, sensitivity specifications, missing-data counts, citation files, and publication metadata.
Initial Missouri pilot release.
Older downloads are retained for transparency, not recommended as the current finding.
Material corrections will update the version, date, changelog, downloadable files, and structured metadata. Minor typographic fixes may update the modified date without changing the measured results.
Free access does not by itself grant redistribution rights. A formal open-data license and DOI have not yet been assigned. Until then, contact LenderCity before republishing the downloadable files.
Source: 2025 FFIEC HMDA public data, local extract dated 2026-08-20. Prepared by LenderCity. Internally checked with a separate calculation; not externally peer reviewed. About Gregg Harris and LenderCity.
Source SHA-256: 58de98efbfa16865ab825bb19f8279d34ff872a99fd6e64f6a6233b08ab92f10